Advanced Reporting
Table of Contents
Advanced Reporting helps you:
-
Gain meaningful insights of data through custom queries.
-
Measure the success of security programs through SD Elements
-
Make strategic business decisions that can increase your security posture, productivity, and growth.
Prerequisites:
-
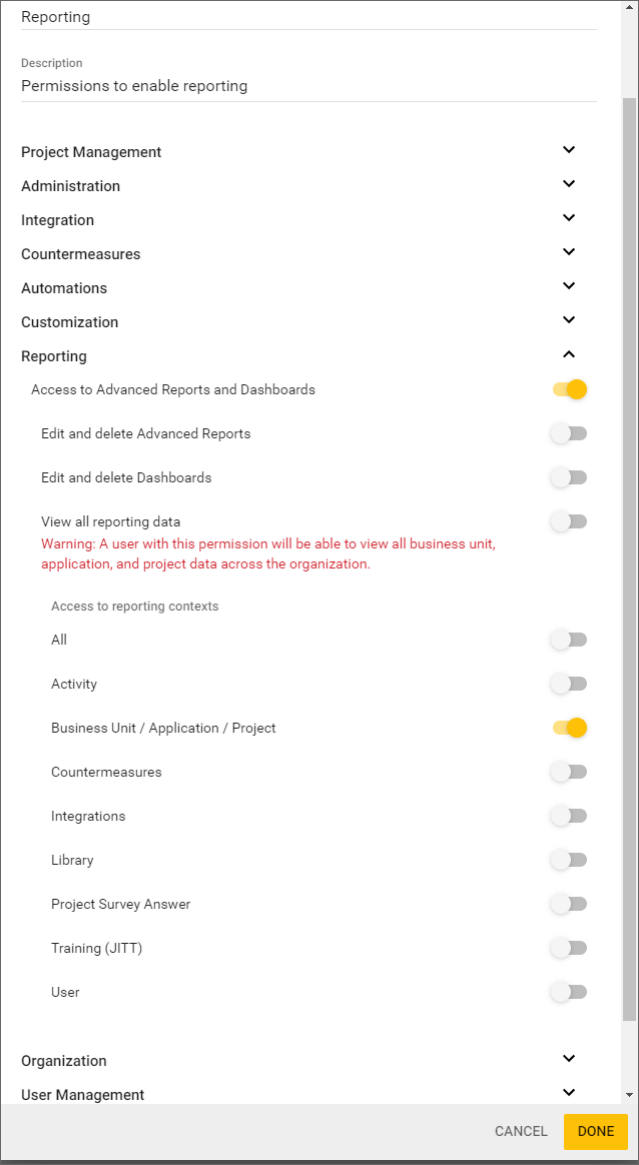
The user has appropriate permissions to access Advanced Reports, Trend Reports, and Dashboard. In the menu, navigate to Manage → Global role → Reporting.
-
The user is working with a container deployment of SD Elements.
| Advanced Reporting is only available on container deployments of SD Elements. |
Access to Advanced Reports and Dashboards |
Allows the user to navigate to the Advanced Reports and Dashboard pages. |
||
Edit and Delete Advanced Reports |
Allows the user to edit or delete advanced reports that are not created by them. |
||
Edit and Delete Dashboards |
Allows the user to edit or delete dashboards that are not created by them. |
||
View all Reporting Data |
Allows the user to view all accessible reporting data.
|
||
Access to Advanced Reports reporting contexts |
Allows the user to access specific reporting contexts so they can create and view specific types of reports. |
Contact sdesupport@securitycompass.com for more information.
Advanced Reports Page
This page contains access to all your saved reports and allows you to build a new report from a blank template. Anyone with permission to view this page will have the ability to see all existing reports and data across all Business Units, Applications, and Projects.
Advanced Report Details
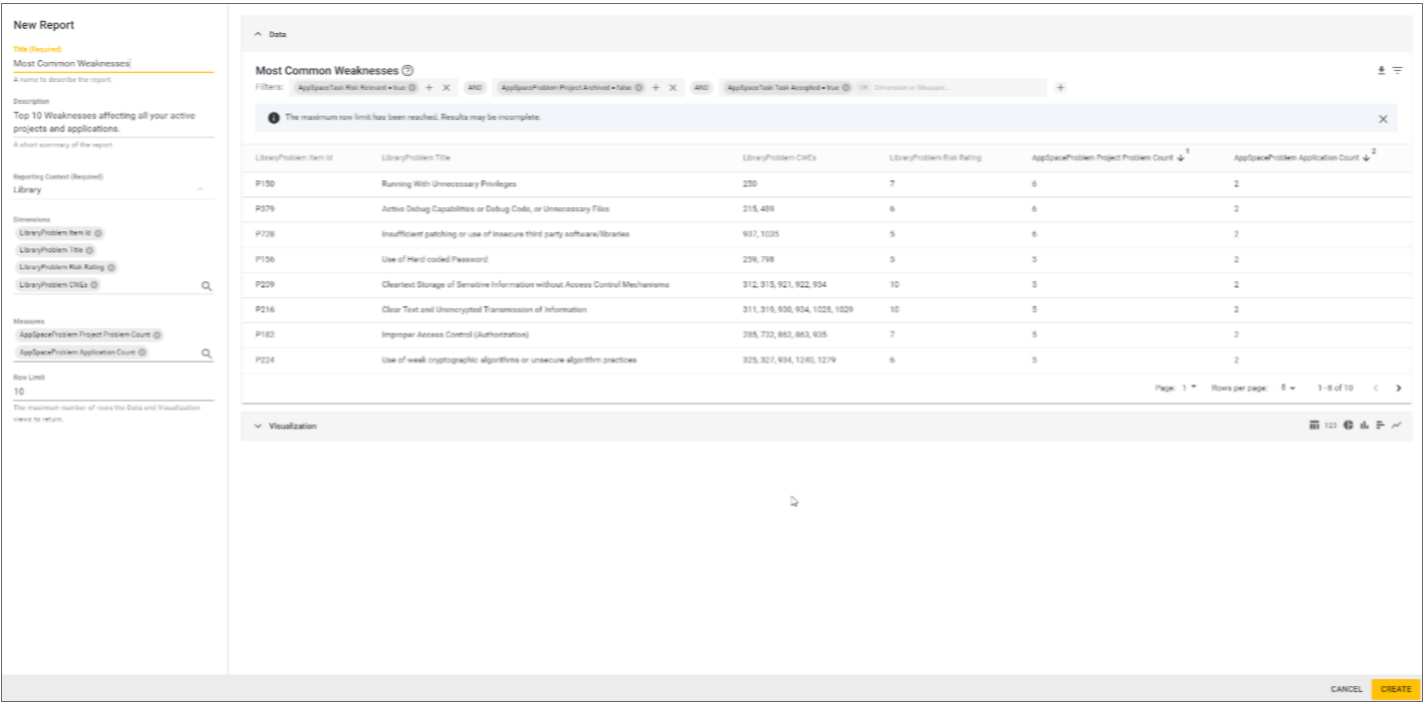
An advanced report has the following properties:
-
Title: A required field that will be the title of the report (character limit: 255)
-
Description: A short summary of the query (no character limit)
-
Reporting Context: A required field that identifies the foundational context from which the data is to be pulled. Current contexts include All (to be deprecated), Activity, Business Unit/Application/Project, Integrations, Library, Countermeasures, Project Survey Answer, Training (JITT), and User.
-
Dimensions: Contain qualitative values (such as names, dates, or geographical data). Dimensions affect the level of detail in the view.
-
Measures: Contain numeric, quantitative values that you can measure. Some measures can be predefined aggregations.
-
Row Limit: The maximum number of rows the data and visualization views return. For Table and Pie visualizations, the maximum number of rows to return is 5000 rows. For the remaining chart visualizations, the maximum number of rows to return is 20 rows.
-
Filters: Provide the ability to dissect and show specific subsets of your data that you want to analyze. Filters allow for AND/OR logical comparison operators. To use an “OR” operator, simply add a filter and you will be presented with additional “OR” inputs. To use “AND” operators, click
+after inserting your first filter and you will notice the separation of filter inputs by an “AND”. The order of operations is based on the order of logical operators. Each block is executed left to right, with the inside of the block evaluated for “OR” inputs.You must select logical comparison operators from the dropdown list. Do not enter comparison operators by typing them in. After constructing your filter, push Enter on your keyboard to apply it. You will receive the error "Invalid Token" while executing an advanced report if it takes longer than 60 seconds to execute. Add additional filters to the report to reduce the number of returned results. It may take at least five minutes for the system to reflect the latest changes to your data. -
Chart: The type of visualization you want to view your report in. Current visualizations include: Table, Pie, Number, Horizontal Bar, Stacked Vertical Bar, Line. The visualization that is selected upon creation or saving will be what renders in the UI when viewing the report.
Building An Advanced Report
To create an advanced report, follow the steps below:
Steps:
-
Open the menu option Reporting→Advanced Reports.
-
Click the plus button. A dialog opens.
-
Select a report template.
-
Choose a Reporting Context:
-
This is a required step before a user can start building out their report. It identifies the foundational context from which the data is to be pulled. Available contexts include:
-
All (to be deprecated): Is the current legacy schema in place that reveals all dimensions and measures across all tables.
-
Activity: Is a context primarily focused on delivering insights into the user activity that is occurring within SD Elements.
-
Business Unit/Application/Project: Is a context primarily focused on delivering insights into the statuses of Business Units, Application or Projects.
-
Countermeasure: Is a context primarily focused on delivering insights into the status of Countermeasures within Projects as well as any relations they may hold across Threats, Weaknesses, and Components.
-
Integrations: Is a context primarily focused on delivering insights into the statuses of integrations across Business Unit, Applications and Projects.
-
Library: Is a context primarily focused on delivering insights into the content within SD Elements and how it is interacting across all of the organization portfolio within SD Elements. This is inclusive of Library Weakness, Library Threats, Library Countermeasures, Library Components, and more.
-
Project Survey Answer: Is a context primarily focused on delivering insights into active answers selected across Business Units, Applications, or Projects.
-
Training (JITT): Is a context primarily focused on delivering insights into how users are interacting with courses/modules and the completion status of those courses/modules.
-
User: Is a context primarily focused on delivering insights into users within SD Elements and their current standing within the organization.
-
-
-
Fill in the fields.
-
Click Create.
Once the report is created, you will immediately be taken to the advanced reports list page.
View An Advanced Report
To view an advanced report, follow the steps below:
Steps:
-
Open the menu option Reporting→Advanced Reports.
-
Click the name of the report that you want to view.
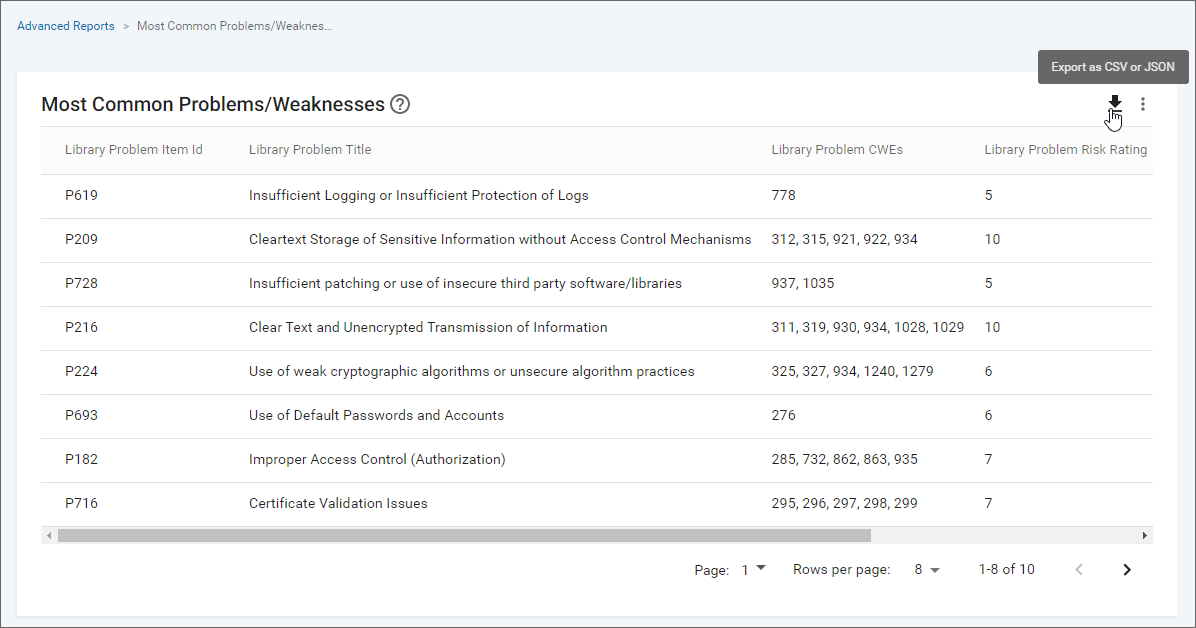
Advanced reports are rendered based on the specified chart type.
Additionally, reports can be exported to either CSV or JSON by clicking on the download button at the top right:
Edit An Advanced Report
To edit an advanced report, follow the steps below:
Steps:
-
Open the menu option Reporting→Advanced Reports.
-
Use the search feature if you need to find the advanced report in the list.
-
Hover over its row on the far right, and click the pencil icon (Edit). A dialog opens.
-
Update the details of the report.
-
Click Save.
Changes to the report are immediate.
Delete An Advanced Report
To delete an advanced report, follow the steps below:
Steps:
-
Open the menu option Reporting→Advanced Reports.
-
Use the search feature if you need to find the advanced report in the list.
-
Hover over the report’s row on the far right, click the trash can icon (Delete). A dialog opens.
-
Confirm that you understand that the report will be removed.
-
Click Delete.
The report is deleted immediately.
Additional Advanced Reports Capabilities
In addition to being able to build a report that is more meaningful to you, there are additional capabilities that allow you to present your findings in more impactful ways. The following capabilities allow for even greater flexibility when building a report:
-
Relative Date Filtering: When using a dimension that is a date/time field, you can choose from static or relative dates. Relative dates allow you to create the report once, and have it dynamically updated based on current date. An example of this type of filter would be: “Countermeasure Updated = Last 30 days”. This will present you with a list of all Countermeasures that have been updated in the last 30 days. It will include the current date.
-
Drag and Drop Columns: When adding columns to the data table, you can rearrange column orders. Click on the title of the column to drag it to any area of your choosing. The landing spot is indicated by a yellow vertical line.
-
Data Sort Order: You can sort the data within the columns (ascending or descending). Sorting multiple columns is also supported. Click on the arrow next to the column header to sort the data based on your selection. A number is indicated next to the sort column to indicate the order of operation for sorting. You can sort by as many columns as you wish and use CTL + Click (on PC) or CMD + Click (on Mac) to deselect the sorted column. The sorting of the data will also be reflected in the visualization.