Executive Overview Dashboards
Table of Contents
The Dashboard in SD Elements provides visual analytics for executive visibility into projects and the ability to export data for self-service reporting. The original dashboard, or Dashboard Classic, is also available with its former reporting functionality.
Activate and deactivate Dashboard
You can activate the Dashboard or return to the Dashboard Classic.
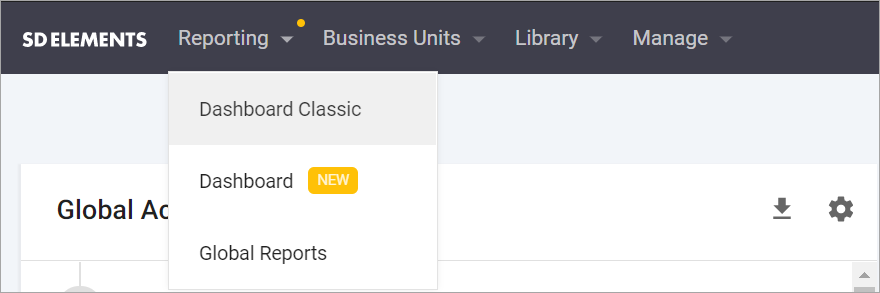
From the Reporting dropdown menu, select Dashboard or Dashboard Classic
Both dashboards appear as tabs along with Global Reports.
Risk Policy compliance reports
Risk Policy compliance by Business Unit
The Risk Policy compliance widget displays the distribution of compliant and non-compliant projects per Business Unit.
Hover over sections of the bar chart to see the percentage and numbers of compliant and non-compliant projects.
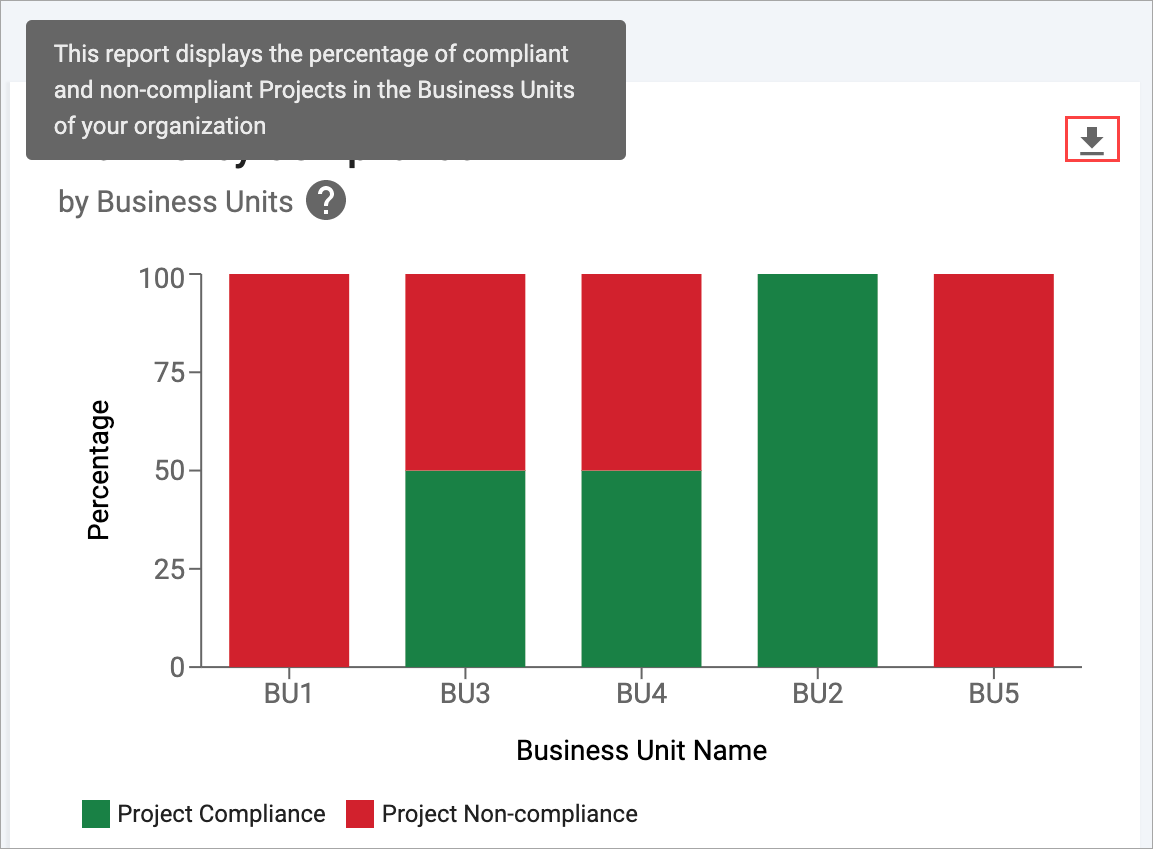
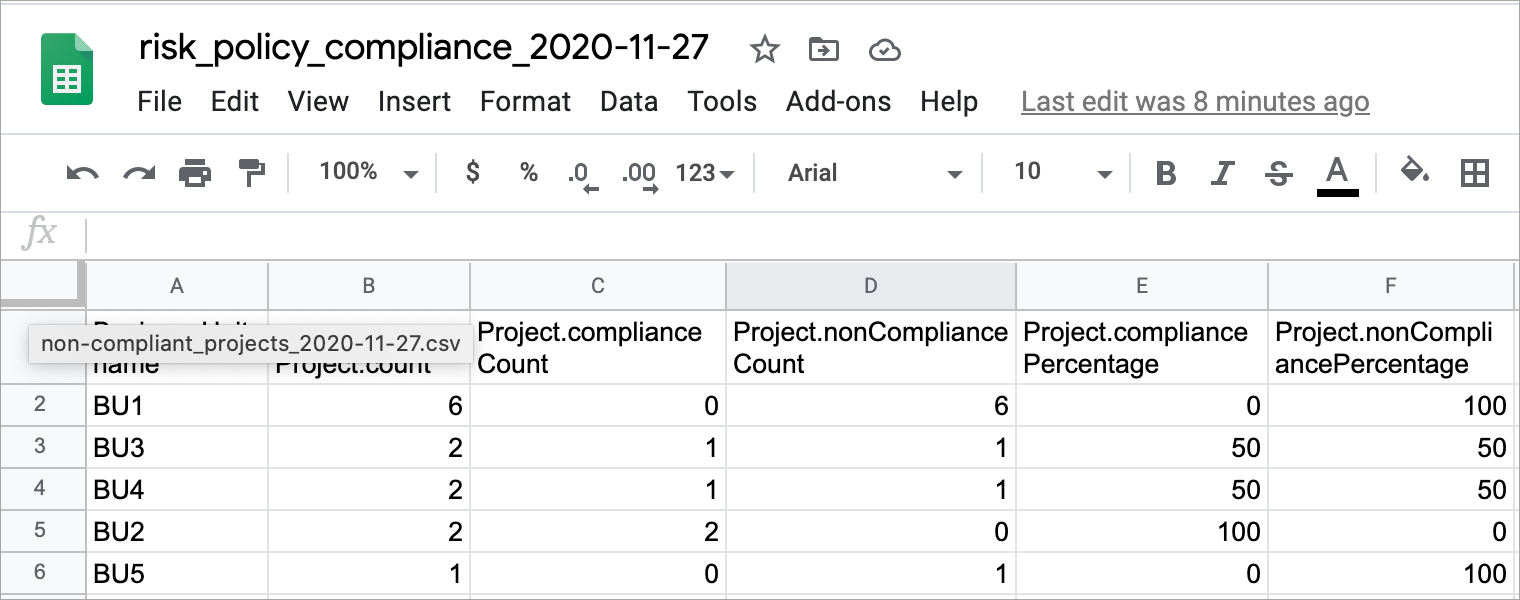
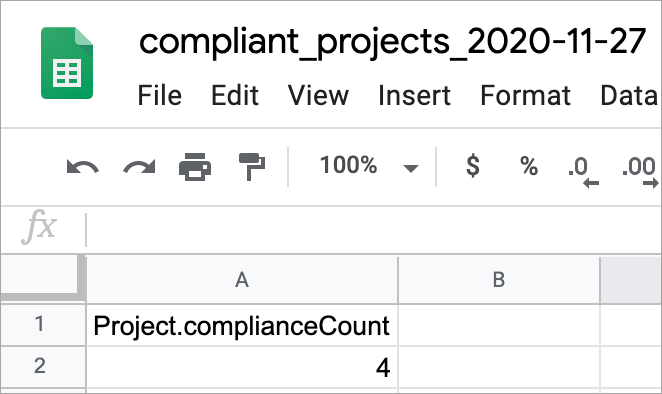
You also have the ability to export the aggregate number of compliant and non-compliant projects for each Business Unit by clicking on the export button in the top right.
This report allows you to analyze the compliance status of each business unit on a per project basis.
Compliant vs non-compliant projects
This widget provides metrics to compare non-compliant vs non-compliant projects.
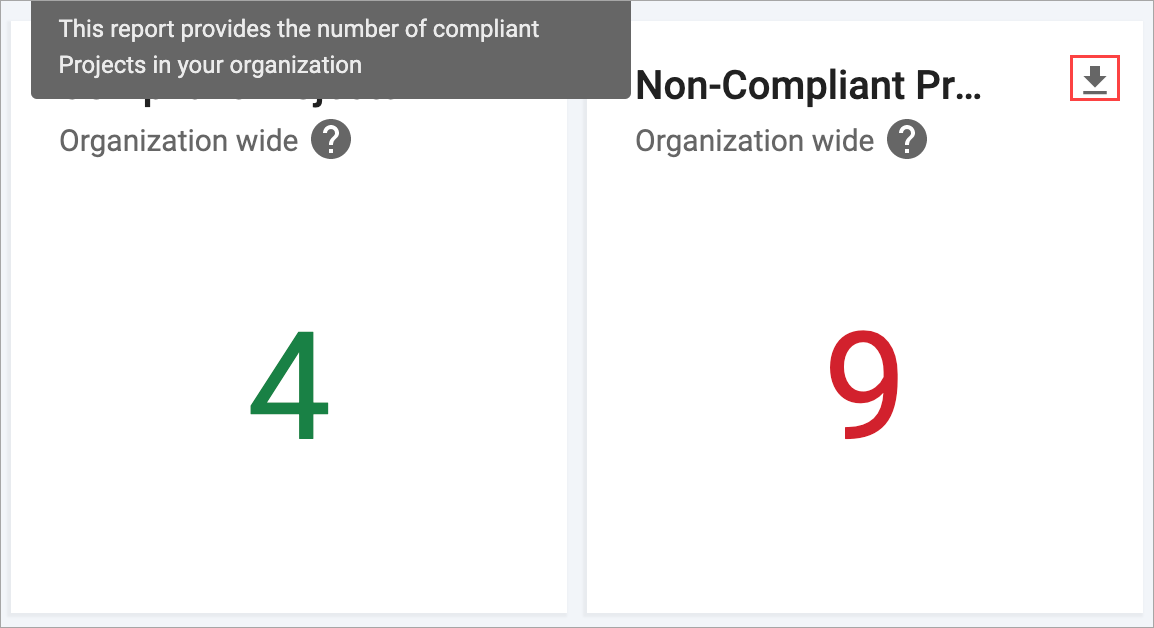
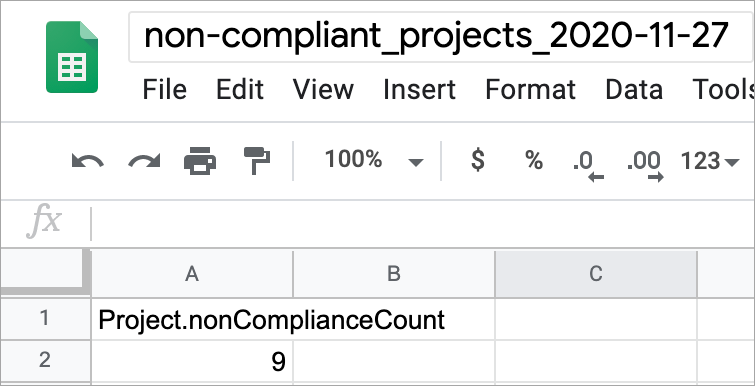
You can export the number of compliant and non-compliant projects by clicking on the export button in the top right.
This report allows you to quickly monitor the work left for achieving compliance.
SD Elements usage metrics
Activities by Business Unit
This widget shows you the aggregate number of activities across all projects in every Business Unit broken down by week. You can use this in conjunction with the activity log export for auditing purposes.
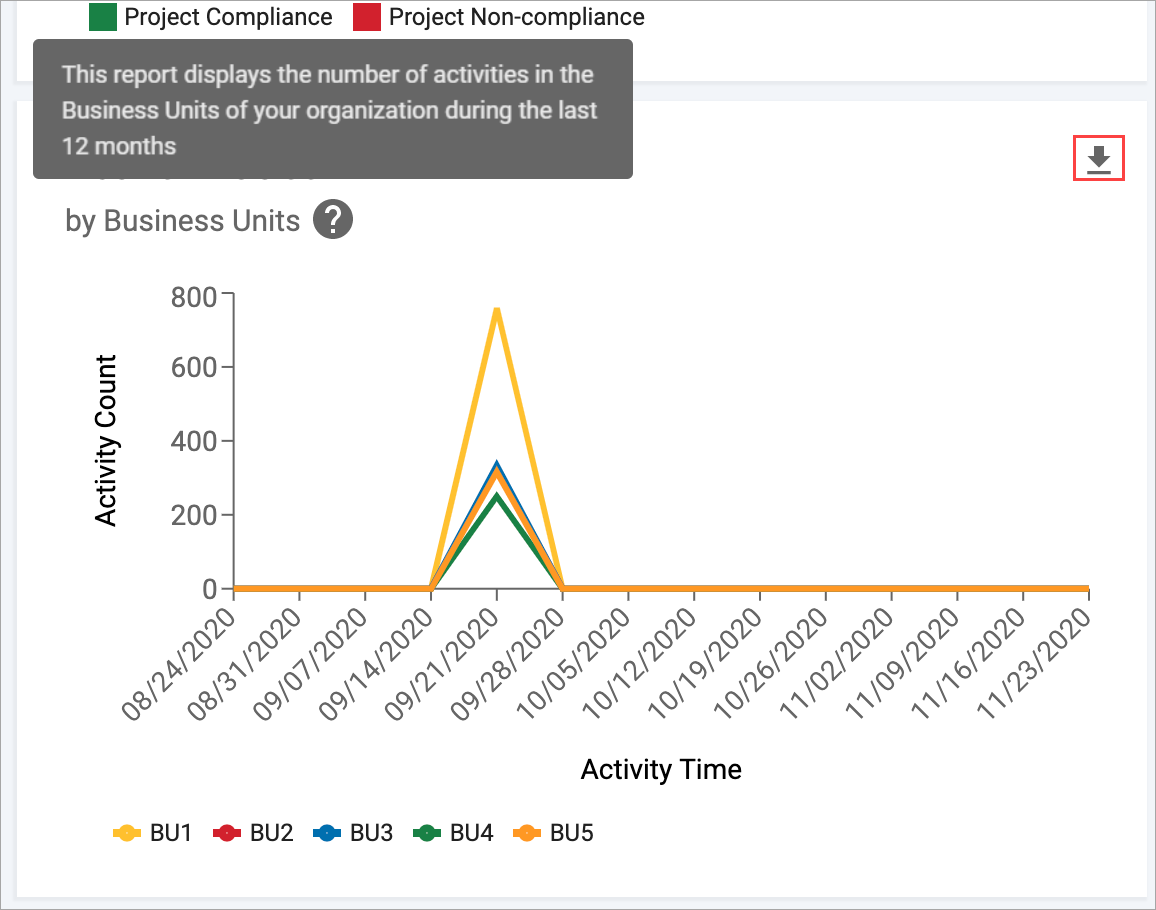
You can also hover over the point in time to get a snapshot of activities across the Business Unit of that particular week.
You can export the number of active entities in your Business Unit by clicking on the export button in the top right.
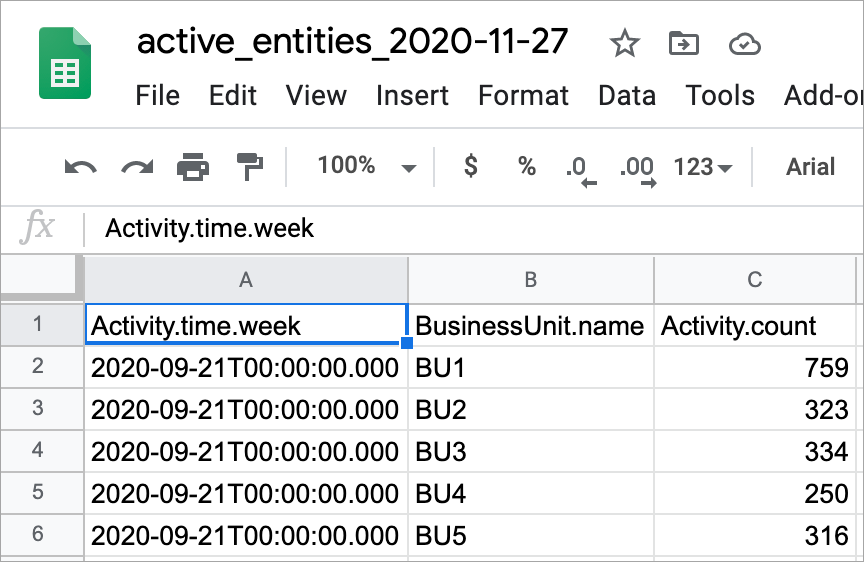
This report provides an analysis of the Business Units that have more active SD Elements Users and those with higher user adoption.
Active projects
This widget displays the number of Active Projects (excluding Release Projects) in each Business Unit during the last three months.
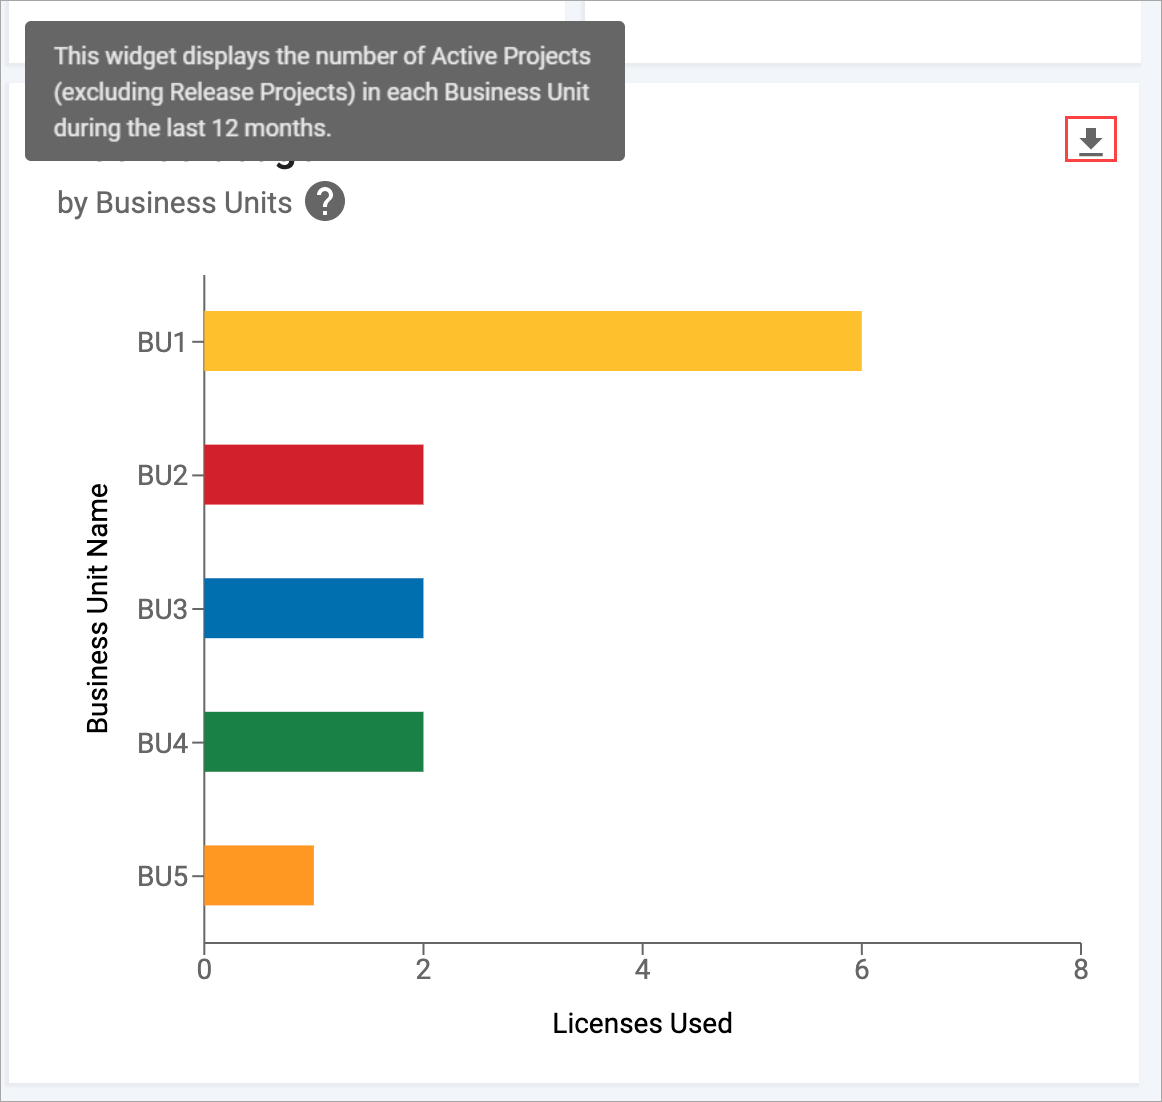
You can hover over each bar to see the exact number of licenses used.
This widget provides a view into the number of base projects across all Business Units.
Project management reports
Project health report
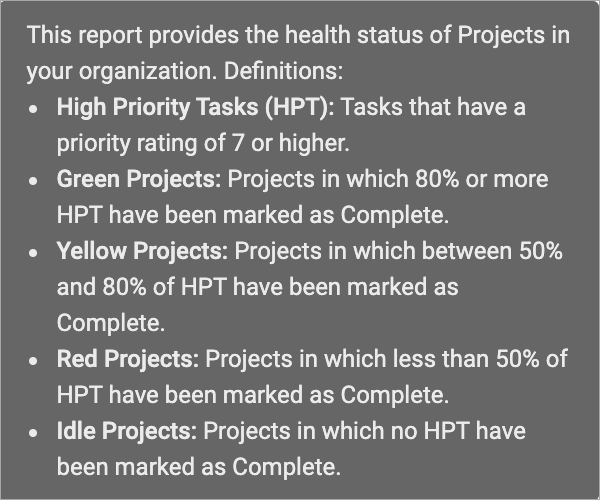
This widget breaks down the aggregate number of projects based on the compliance health of High priority Countermeasures (priority rating 7 or higher) that have been completed.
You can hover over the pie chart to see the distribution of projects with a particular health status by percentage and the number of projects that make up that percentage.
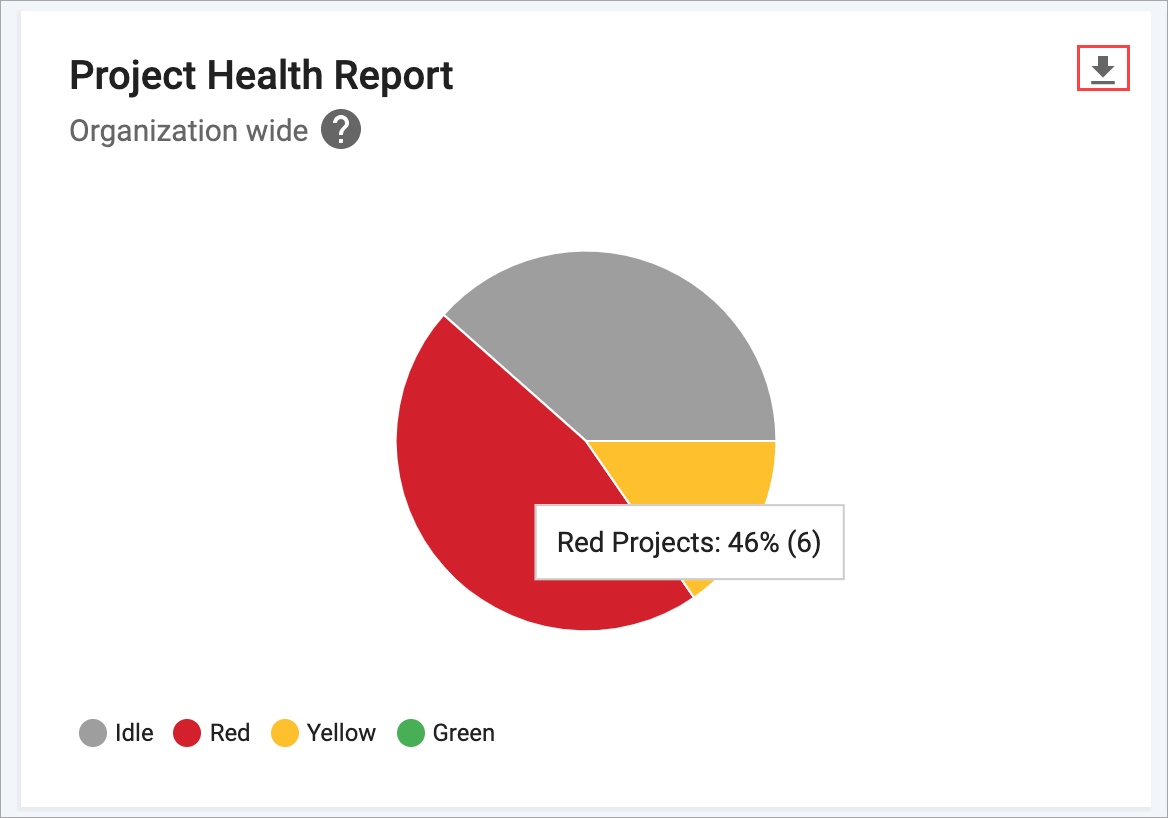
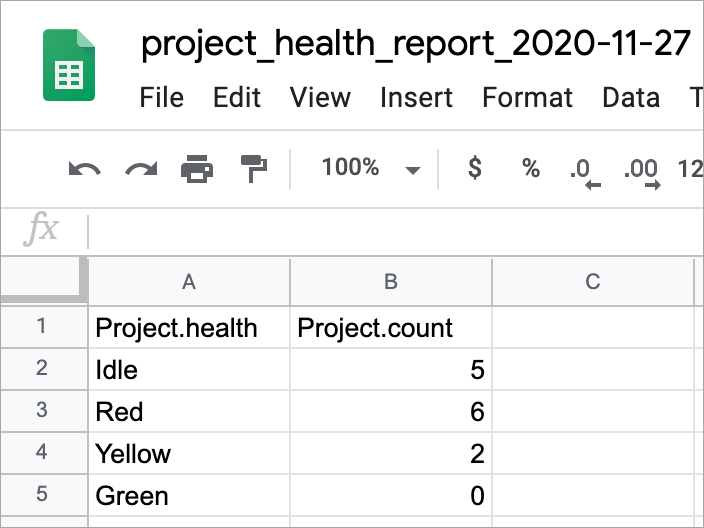
You can export a project health report by clicking on the export button in the top right.
This report allows executive users to monitor the overall security and compliance health of the organization. It can also be used to monitor the compliance posture of projects on a regular basis.
Countermeasure completion
This widget shows the distribution of Countermeasures and Custom Countermeasures based on their completion status.
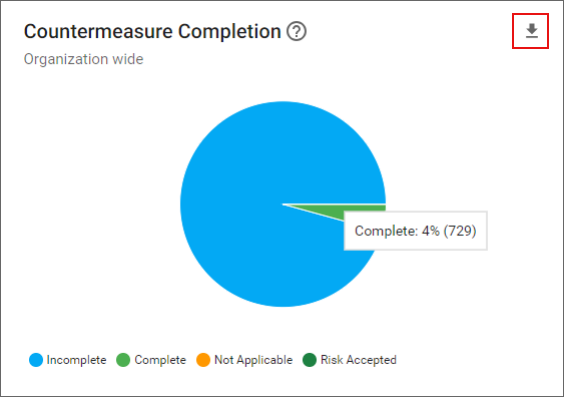
You can hover over each section of the pie chart to see the distribution of Countermeasures as a percentage and number based on an Incomplete, Complete, or Not Applicable status.
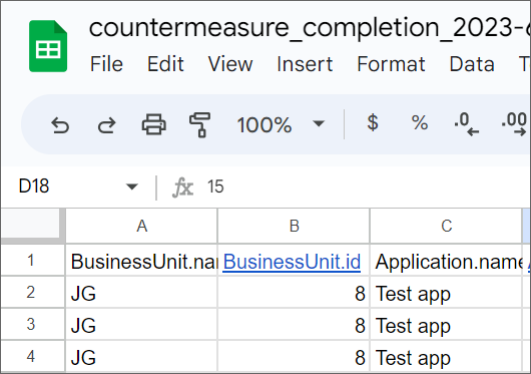
You can also export a Countermeasure completion report by clicking on the export button in the top right.
Risk Classification by project
This widget provides a table of all projects in the organization against their Risk Classification. This view consolidates all projects against their classifications to help you manage the risk of sensitive Countermeasures throughout their development cycle.
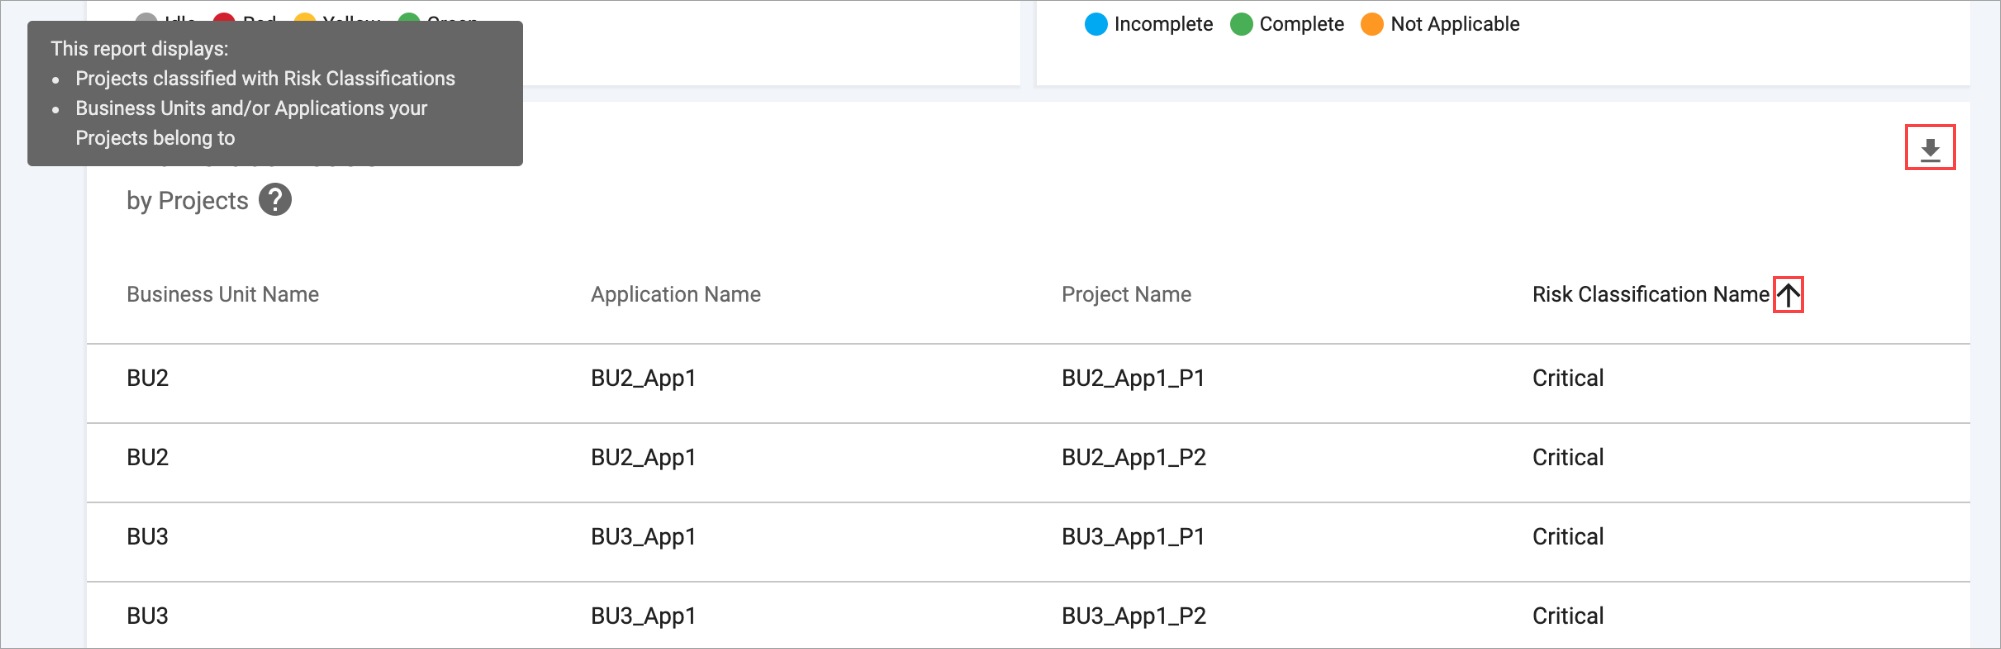
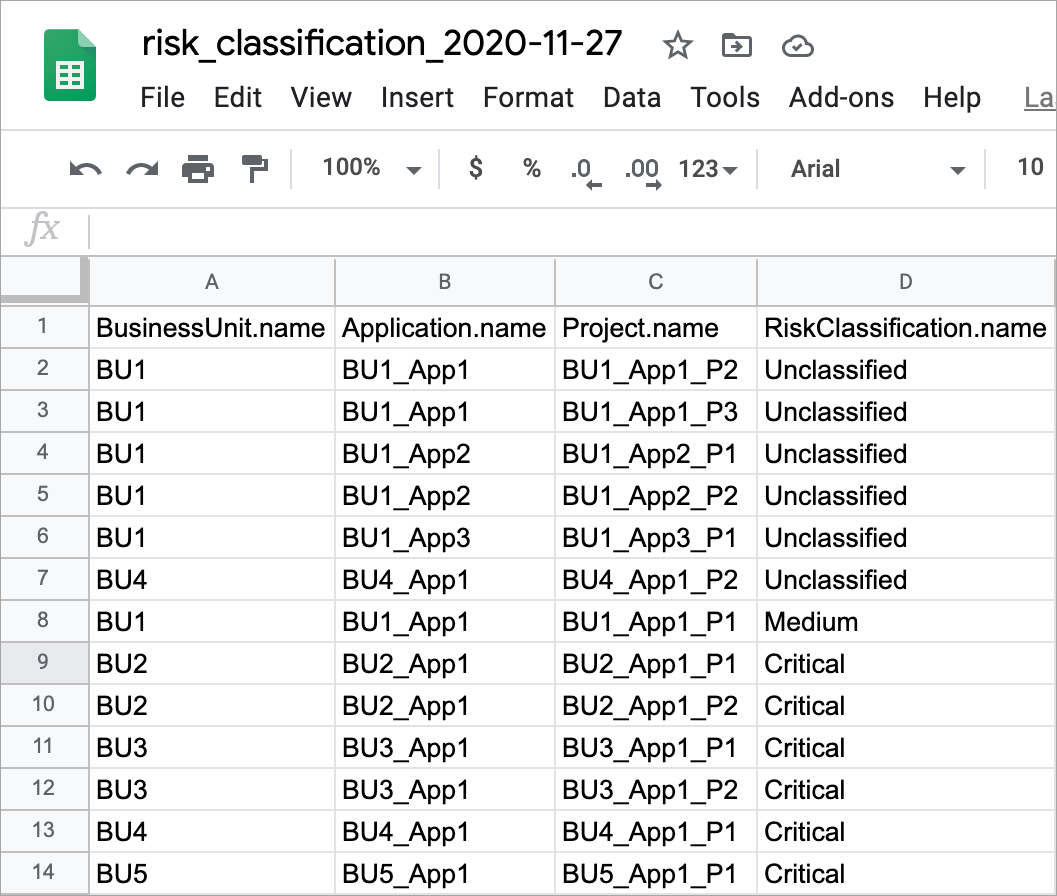
You can click on the sort button to monitor projects in a specific risk category, or the export button for a report.
Filters
Filter the SD Elements Dashboard to highlight specific date ranges or applications.
Filter by date
Steps
-
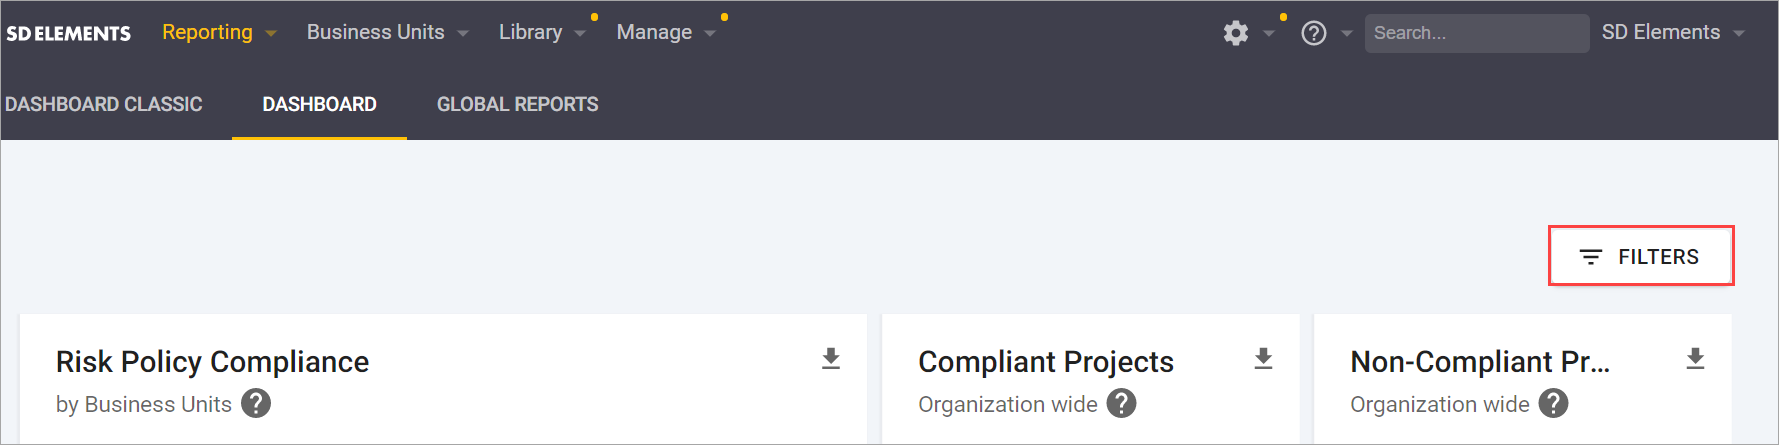
From the Dashboard, click on the Filters button.
-
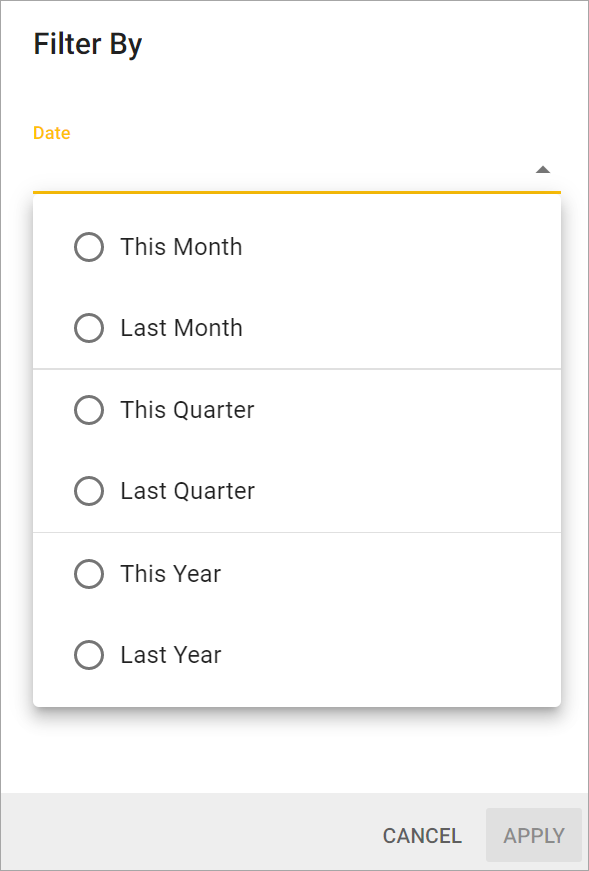
Select one or more date ranges to filter your Dashboard by.
-
Click on Apply.
Your SD Elements Dashboard is now filtered by the dates you selected. Remove date filters by clicking on the Filters button, and then clicking on the x to the right of the Date field.
Filter by application
Steps
-
From the Dashboard, click on the Filters button.

-
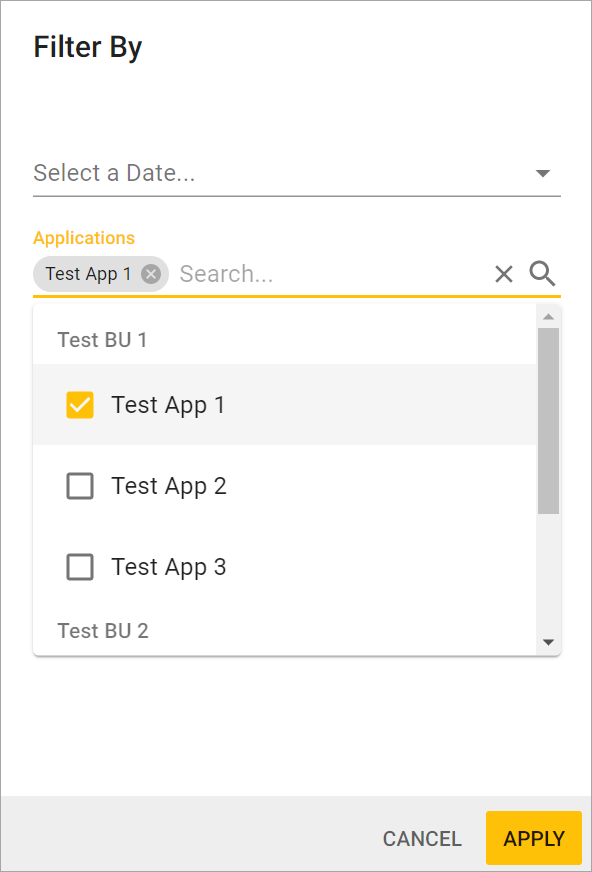
Select or enter one or more application names. Applications are divided by business unit.
-
Click on Apply.
Your SD Elements Dashboard is now filtered by the applications you selected. Remove application filters by clicking on the Filters button, and then clicking on the x to the right of the application names.